To maximize profitability, companies must have a firm grasp of what it costs to manufacture and process each product. This becomes increasingly challenging for large companies with thousands of employees and long supply chains or multiple manufacturing plants.
This study demonstrates how a full integration of CAT Squared’s costing system enables a return on investment of less than just a few months.
Company profile
• Product specialties: Poultry parts
• Primary customers: Retail-grocer and foodservice markets
• Production: Processes 140,000 tons of poultry per year.
This project was completed in 2016 at a European plant for one of the largest animal food producers in the world, with a worldwide annual production of 23.2 million tons.
Like many food producers, this customer maintains a long supply chain and uses many resources (meat, equipment, employee labor, packing materials, etc.). Additionally, it produces more than 300 SKUs with huge variations on the amount of resources consumed per product and per department. That’s why it’s challenging to assign specific costs to each product. As result of these issues, plant management could not determine which products were making money and which were losing money.
This processor operates in a highly volatile environment where meat prices fluctuate dramatically. Management needs information to make decisions on which products can be culled and which should be pushed during various market conditions.
Prior to installing CAT Squared's costing solution, this customer could not accurately determine the value of work-in-progress (WIP) and cost-of-goods-sold (COGS), which are required for monthly reporting in the accounting system. The ERP system they were using from SAP could not provide this information because most ERP systems do not seamlessly integrate into plant floor operations systems. Also, the auditors would not accept the spreadsheets plant employees were using because they could not provide full traceability and validate how their numbers were calculated.
Traditional costing assigns costs to products based on an average overhead rate using budgeted and estimated costs and volumes to determine what the standard cost should be. This does not provide an understanding of what the real and actual costs are, only the variances from standard. Standard costing variances could fluctuate dramatically from month-to-month without ever providing any answers on real costs.
With traditional costing, management focuses on variances from “the standard,” forcing an acceptance of the “standard” as the norm, not the actual costs. Standards are generally set once a year during budget season and mostly not changed until next year’s budget cycle. So, when manufacturing conditions, input costs, capacity utilization and other major impacts happen during a year, management has no perspective on what the impact of these changes are (unless standards are re-calculated, which does not often happen).
Activity-based costing (ABC) changes all this by providing actual month-to-month costs, empowering management to adapt to changing conditions by adjusting prices, manufacturing mix, product selection and other necessary changes. ABC assigns costs to each activity in the manufacturing process, providing a step-by-step view of how costs accumulate as products move through the plant and a focus on how resources are used.
Solution
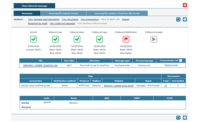
CAT Squared (CAT²), Conway, Ark., implemented an activity-based costing system that traces products step-by-step through the production process, enabling plant and financial managers to understand the cost of every activity, process step and components of a product’s cost.
CAT²’s costing solution provides a financial perspective on process yields and all production losses. The uniform, consistent structure of the system helps production and finance managers “talk the same language” while working together to create continuous improvement in productivity and profitability.
The system is auditable with full traceability of costs from product back to all inputs.
Features
• Follows the product step-by-step through the production process, making it easy to understand how costs accumulate.
• Converts yield losses and gains into monetary values, making it clear what the cost of these losses may be.
• Provides inventory, WIP and COGS results for input into financial systems.
• Uses all production data from CAT2, helping to ensure the integrity of production data, highlighting gaps.
• Uses matrix algebra to accurately and efficiently solve costing.
• Links staff and equipment resources to activities and costs, helping to understand resource usage.
• Exports to Excel for further analysis.
Benefits
• Provides regular costing updates.
• Shows profit or loss for every product line.
• Makes it easy to run alternative (what-if) scenarios if meat or packing costs suddenly change.
• Provides a complete view of inter-organizational and overhead charges.
• Shows waste otherwise hidden in the production figures.
• Identifies products and customers that add or destroy value by incorporating cost-of-capital into costing.
• Simplifies critical financial decisions by providing a clear picture of all fixed and variable costs.
CAT² combines the plant floor data managed by its MES with the accounting data housed in SAP's ERP system to assign values and distribute costs across activities, departments and products. All transactions have the same logic, tracking inputs and outputs for each department and each product. All data is validated and provides complete traceability.
Results
For the first time, this poultry processor’s management team has access to accurate, provable data to aid in decision making. Prior to installing this solution, the company’s manufacturing data did not balance. Scales weren’t working properly. Products were either not being measured or being measured twice. CAT² recalibrated their scales, began validating their information and checked the validity of results in the costing system.
This empowers plant management to:
• Be responsive to market changes,
• Improve production efficiencies, and
• Control waste.
This project revealed significant waste in the company’s processes related to packing material waste, DOAs, yield losses and re-work. For example, CAT² identified a $40,000-per-month loss in packing materials due to poorly functioning machines. Wherever the team identified waste, CAT² assigned specific values to that waste in the process, and the system automatically calculated the loss. Plant management quickly identified areas of potential savings.
CAT²’s valuation reports can be used for audits as well, providing an audit trail, so auditors can sign off on reports. Prior to installing this system, plant management could not produce accurate valuation figures because their spreadsheets were not accepted by the auditors due to lack of validation. CAT²’s system is fully integrated into the plant’s processes, and every movement is calculated within CAT2.
This system provides full traceability as to where an item is and why it’s there. The reports also show how calculations were done, how overheads are allocated, etc.
During this project, CAT²’s team found that there were several products being produced that weren’t earning a profit at current prices and others where production could be expanded profitably. With this new level of data analysis available at a glance, this poultry processor was able to see complete ROI on the installation of CAT Squared’s costing solution within just a few months.


