Crop management robots
Small Robot Co., UK, announced its first commercial service for weed mapping and previewed the next generation of its Tom monitoring robots.
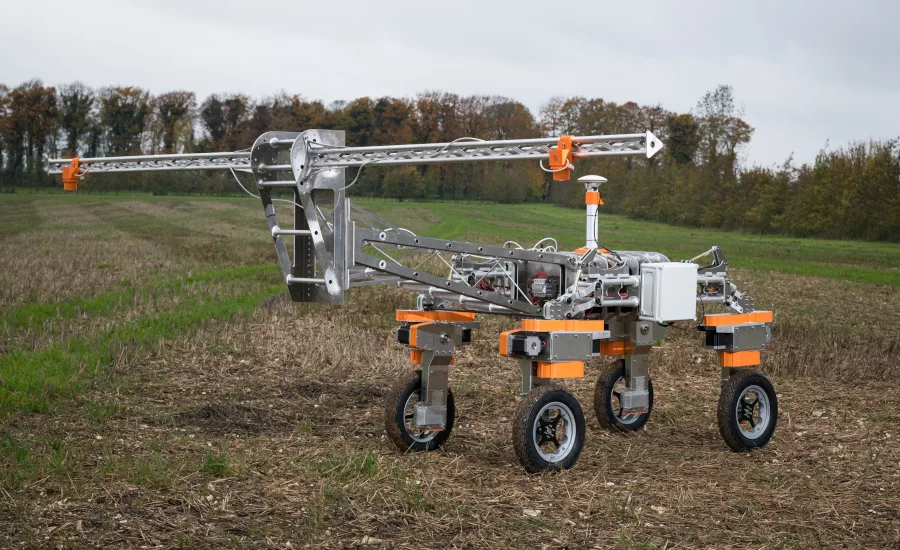
Tom will autonomously cover 20 hectares per day, and can distinguish plant details at sub-millimeter resolution, with less than one millimeter per pixel resolution on the ground. The next generation Tom design incorporates factors such as weather-proofing, speed, camera capacity and extended battery life. Designed from the ground up, it carries double cameras, exponentially increasing monitoring capacity to 4 meters squared and covering 20 hectares per day. The new Tom weighs only a few hundred kilograms, and will be truly autonomous. For the initial service, it will be handled by a single robot operator, and will fit in a small van, so it can be easily taken from one farm to another.
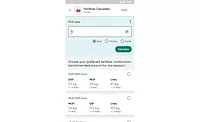
Small Robot also released an early version of its Wilma artificial intelligence interface for farmers to view and interpret the data for decision support. It is anticipated that integration with existing farm management information systems, Wilma will help make current machinery more efficient, for instance for variable rate spraying. Wilma can now detect both broad leaved weeds and emerging wheat, following extensive training using tens of thousands of images from last year’s data collection. Work is now underway for identification of grass type weeds such as blackgrass, brome and ryegrass, the mapping of which is scheduled to follow in the fall of 2020.
Working in conjunction with Wilma, the Tom robots will:
- Measure the efficacy of broad leaved weeds herbicide applications by doing a post-spray weed count.
- Map weed populations to allow for focused remedial treatments the following year.
- Inform decisions as to whether farmers spray or don’t spray for broad leaved weeds, particularly in the spring.
The data on emerging wheat provides a highly accurate tiller count, which:
- Influences crop management decisions throughout the season, in particular to apply variable-rate nitrogen on the areas where plant density is low.
- Can be overlaid with an existing yield map to determine optimum plant population in future years.
- Influences future planting decisions for plant density. This data could additionally produce a yield map to help farmers assess the ideal size of plant population for their field as well as opening the way for variable rate drilling.
- Can give an indication as to vulnerable areas for slugs.
Small Robot Co.
+
www.smallrobotcompany.com
Looking for a reprint of this article?
From high-res PDFs to custom plaques, order your copy today!

")