Cloud computing and data storage is the next stage in the Internet's evolution. Users no longer need to concern themselves with the issues of earthbound  computing such as availability, storage requirements, software upgrades, data backup and the like. Instead, all of the above and so much more can be delivered to you as a service wherever and whenever you need it.
When first conceived, some implied that the Cloud was simply water vapor that would disappear into the blue sky. Now, all of the major players are in the game. The Cloud gives companies like M&M Refrigeration, Federalsburg, Md., and its customers the ability to have a vast amount of computational and information technology resources available at the snap of the fingers. The possibilities are endless.
The challenge
Refrigerated facility owners, managers and operators are faced with what would seem to be a simple task of keeping things cold and moving product in and out to meet their customer’s needs. The principle may sound simple, but in reality it is a complicated orchestra of multiple disciplines that all need to be focused on the dollars at the bottom line.
The two major costs for any refrigerated facility are labor and power consumption. Typically, labor costs are relatively easy to determine. Payroll and its associated expenses are known and controllable. Power cost can be controllable, but typically those costs are not known until the power company bill arrives. The only recourse you have at that point is to pay the bill and try to do better in the future. Shifted billing cycles, variable billing period durations and an information lag are problematic in trying to control this major cost for a facility.
In order to manage anything, you need to be able to measure it, monitor progress and get information when you need it. To check your health, you measure your pulse and blood pressure. The challenge for facility owners and operators is to determine how efficiently the facility is operating RIGHT NOW. What is the energy usage pulse of my facility?
The solution
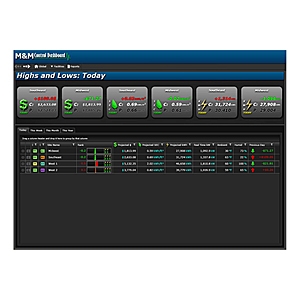
M&M Refrigeration responded to this need with the development of its Energy Initiative (EI) Dashboard. This Cloud-based monitoring and alert system promotes better power and facility management by consolidating information from multiple locations into a common platform accessible through a standard web browser. This gives owners and managers an overall top level view of the company. From the Global View screen, owners and managers can see information from multiple facilities in real time. Readably visible are:
• $$$—What are my costs?
• Power usage—KWH and Demand KW
• Efficiency—Specific Energy Consumption (kWh/Ft3)
• Ambient conditions • Which facility is the best and the worst
• Which facilities are meeting their efficiency targets and which are not
The Specific Energy Consumption (SEC - kWh/ft3) in real time provides the pulse for the system you are looking for. This normalized efficiency number can be used to compare facilities with similar functionality, and to better understand differences from day-to-day operations. Costs and power consumptions can be viewed in multiple time frames (today, this week, this month, this year) to meet the needs of everyone from the engine room to the board room.
The control systems at refrigerated facilities (including your own products) are good at providing a portal into the operation of the facility. The design of these systems has always been oriented toward the engineer or operator responsible for making things cold, and because of that, all of the details are available to view and adjust. M&M Refrigeration works to change their products to provide more information to its users, not just more data. The EI Dashboard facility page does just that. Drilling down to the individual facility page on the EI Dashboard provides a “God’s Eye View” of what is happening in real time at a facility. Owners, managers, engineers and operators can easily visualize the following:
Today’s known and historically predicted values for:
• Energy cost
• Energy usage
• Efficiency
Current values and last 24 hours of:
• Demand KW
• System pressures
• Area/room temperatures
Current status of:
• Ambient conditions
• Important site health and compliance information
• Active alarm and failure information
One of the key design elements of the EI Dashboard is the visualization of data. The many design elements and data widgets have the common goal of allowing users to understand at a glance what is happening. Allowing users to visualize, manage and compare all of their facilities in real time in a manner that previously was not available.
For additional information, contact Hank McConnell at 386-676-7335 or Chuck Toogood at 443-786-7400.


