Grocery e-commerce survey reveals consumers shopping both online and in store
Conventional grocery remains the most frequent grocery channel.
2018 saw an acceleration in online grocery shopping adoption, thus increasing shopper frequency and basket size. Meanwhile, perceived quality increased and repeat and expected trial scores improved. And, Amazon is growing, but appears to be shedding some share points, as outlined in a survey by RBC Capital Markets, New York.
Below are our key findings from the survey:
E-commerce and Amazon
1. Grocery e-commerce trial accelerated to 36% in 2018 from 25% in 2017 (20% in 2016).
2. Of respondents who currently don’t use online channel for grocery shopping, 19% (up from 10% in 2017) indicated they would begin doing so in the next six months.
3. Frequency of online grocery shoppers increased (22% use online channels one or more times a week, up from 11% in 2017).
4. Online basket size grew (of those who purchased groceries online, 48% said their order size was same as or larger than a trip to grocery store, up from 26% in 2017).
5. Online offers a large opportunity, with 2% penetration. Online grocery providers should benefit from secular shift.
6. Amazon saw a 10pp increase in Prime members, likely at 65-70% penetration in the United States.
7. Amazon Prime Now penetration at 20% and will continue to grow.
8. Amazon continues to be the most frequently used option for online grocery shoppers.
9. About 35% Prime members enjoyed discounts at Whole Foods for grocery shopping.
10. Awareness and usage of other online channels, primarily Walmart/Jet.com, click-and-collect options and Instacart grew by at least 3pp year over year.
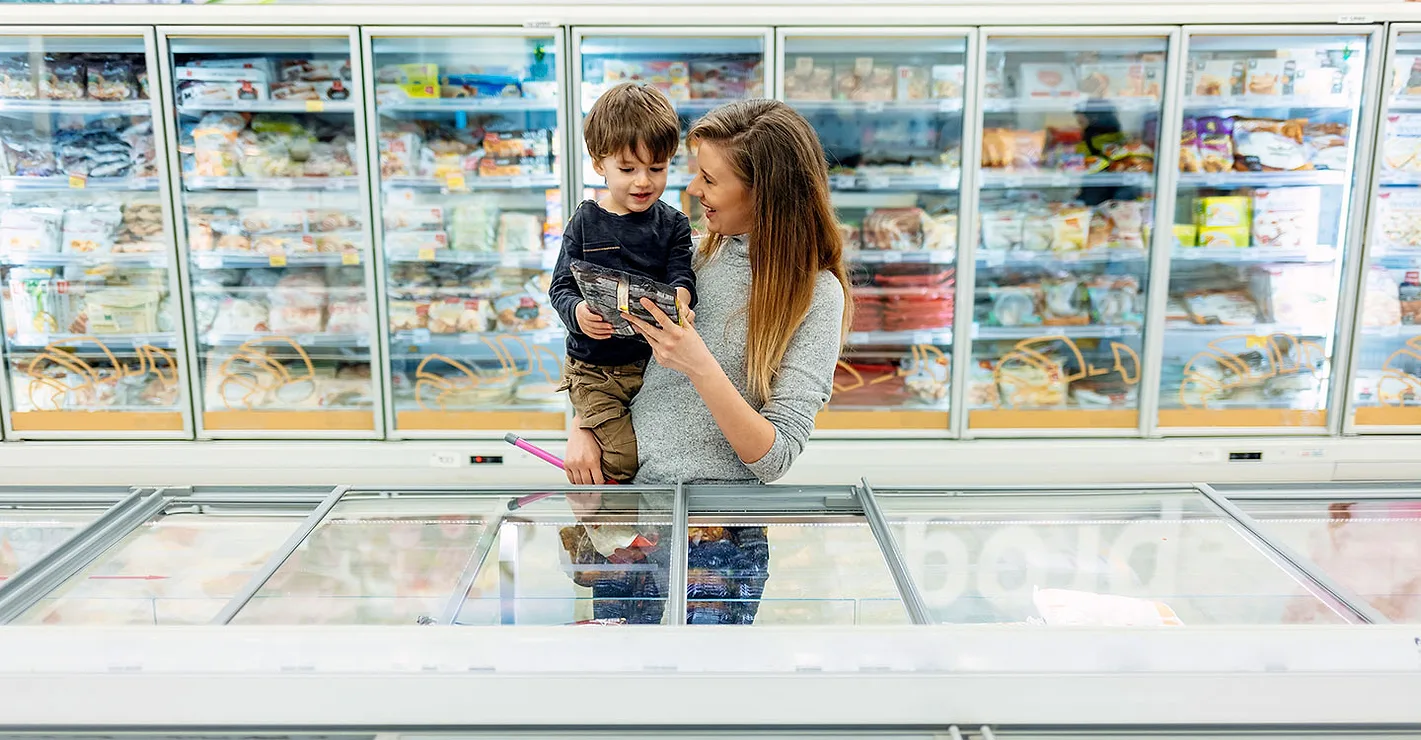
Brick and mortar trends
1. Supercenter share gains accelerated. Use as a primary channel increased (26% from 20%).
2. Conventionals remained the primary grocery destination, but lost share (57% from 61%).
3. Shoppers identified prepared food as the largest improvement observed at their primary grocery store (24% saw improvement from 20% last year).
4. Shoppers are increasingly focused on price in deciding where to shop (39% from 34%).
5. Location (though still important) is being de-emphasized (26% from 31%). Online grocery availability makes trade areas larger and physical location less important.
6. Increasingly, shoppers look to secondary locations for perishables (produce 52% from 44% and meat 49% from 43%).
7. Shoppers showed an increased willingness to switch primary stores (25% from 17%).
8. Coupons/loyalty programs are becoming a bigger influence in shoppers’ purchase decision (25% from 20%).
9. 90% of people surveyed observed higher prices or no price change at Whole Foods stores.
10. “Can’t touch/feel items” is largest concern with online grocery (46% of shoppers identified as the largest issue from 42% in 2017).
In which channels do you purchase groceries?
Conventional grocery remains the most frequent grocery channel (83% of respondents), but is down from 87% in 2017 and 92% in 2015. Impressively, supercenter (e.g. Walmart) increased dramatically to 71% from 59% in 2017 and 53% in 2015. Online grocery shopping also increased, with 19% of respondents saying they use the channel (11% in 2017 and 5% in 2015). On average, respondents indicated they use 2.77 channels for their grocery needs, up from 2.59 in 2017 and 2.55 channels in 2015.
Which of the following has the largest impact on what you purchase at your primary grocery store?
In 2018, respondents increasingly indicated that couponing and loyalty programs are influencing what they purchase at the grocery store (25% in 2018 from 20% in 2017). This shows the efficacy of increased personalized couponing/promotion. Retailers who have a robust shopper profile for customers can offer deals that less sophisticated retailers cannot. This also makes the strong data owners preferred partners with CPG companies.
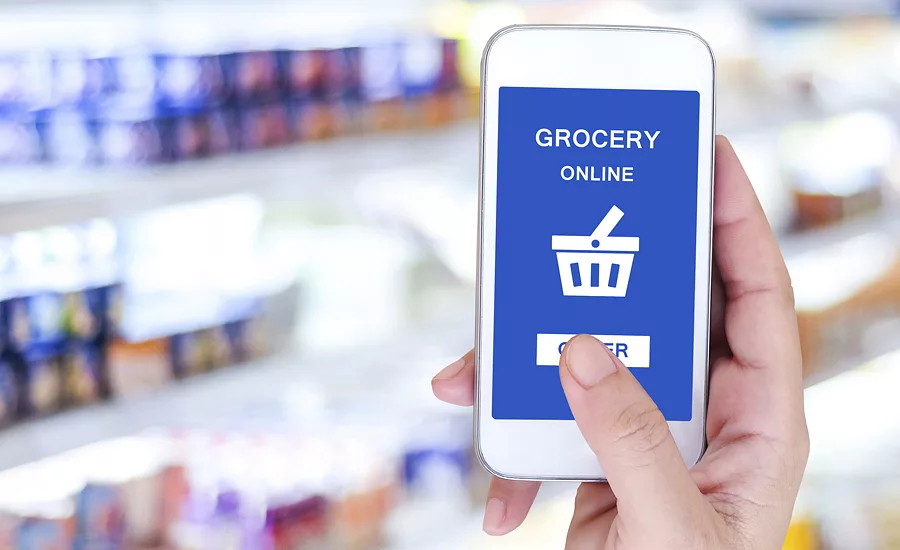
Have you purchased groceries online?
The survey shows an acceleration in the number of respondents who have purchased grocery online (36% in 2018 up from 25% in 2017 and 15% in 2015). The 11pp increase in usage, a significant acceleration, is related to increased quality (5pp) and increased availability from click-and-collect and Instacart. With availability likely to further increase in 2019 and respondent indications that trial will increase (9pp), this trend is expected to continue moving up.
Have you purchased grocery items at Amazon (including AmazonFresh, Amazon Prime, etc.)?
In the 2018 survey, 28% of respondents indicated they had purchased groceries from Amazon. This is up 7pp from the 21% of respondents in 2017. However, it is less than the increase observed for respondents using any form of online grocery (up 11pp). This suggests that while Amazon online grocery is growing, it is losing share. This is likely the result of new click-and-collect options being the largest driver of online category growth. As Amazon rolls out pick-up services and/or benefits from increased Prime Now availability, this trend will stabilize.
Approximately, how often do you purchase groceries online (if you purchase online)?
Online grocery shopping is becoming more habitual. Of those who use online for grocery, 22% of respondents indicated they do so at least once a week. This is up dramatically from 11% in 2017. With satisfaction scores and availability increasing, the frequency should continue to increase and close the gap to the 86% of respondents that say they do some form of grocery shopping at least once a week.
What is the leading contributor for choosing your primary grocery store?
Price, always the most important determinant of grocery shopping habits, was even more important in the 2018 survey. Case in point: 39% said it was the leading reason in deciding a primary grocery store, up from 34% in 2017 and 33% in 2015. Location/facility was still the second most important thing (26%), but it decreased from 31% in 2017. As online options improved and became more widely available, the location of a physical store became less important.
How frequently do you purchase groceries (i.e. number of trips)?
Frequency of grocery trips is growing. This is generally a negative for the industry, as the smaller basket sizes make it harder to leverage labor. Nearly 14% of respondents shop less than once a week (18% in 2015), and 44% of respondents shop once a week, up from 41% in 2015. Twice-a-week shoppers also increased slightly.
How has your primary grocery store improved over the last five years?
Primary grocery stores have increased most with perishable and prepared food offerings. In fact, 26% of respondents indicated perishables were the leading improvement at their primary grocery store (from 22% in 2017). Likewise, 24% of respondents indicated prepared food improved most at their primary grocery store (from 20% in 2017). As evidence that shoppers are more willing to switch stores (a negative for the category), 25% of respondents said they changed primary stores in 2018. This marks a 4-year survey high (17% in 2017).
Are you more satisfied or less satisfied with your primary grocery store compared to five years ago?
For the first time in this survey’s history, at least 50% of shoppers indicated they were more satisfied with their primary store than they were five years ago (just 42% in 2017). Excluding those who have changed their primary grocery stores, 46% of shoppers are more satisfied this year compared to 41% in 2017.
Which items do you purchase at a store other than your primary grocery store?
Respondents are still most likely to shop at a secondary location for fruits and vegetables (52% from 44% in 2017) and meat, poultry and fish (49% from 43% in 2017). This is consistent with survey results that showed the number of average channels a shopper uses increased.
If you have purchased groceries online, have you done so in the last three months?
About 74% of respondents who have used online for grocery have done so in the last three months. This is up from 68% in 2017 and just 55% in 2015. This indicates that shoppers are more satisfied with the channel.
If you purchased groceries online, do you anticipate continuing to do so?
Close to 79% of respondents who use the channel indicate they plan on continuing to do so. This is a 4-year survey high (77% in 2017).
If you buy groceries online, where do you buy most often?
The survey revealed that Amazon is losing lots of primary online grocery share. The directional results are consistent with the accelerated roll-out of Instacart and click-and-collect options. Amazon as the most frequent destination for online grocery decreased to 38% of respondents (from 74%). Walmart/Jet.com increased to 15% from 5%. Similarly, Instacart increased from 3% in 2017 to 8% in 2018. “Other” increased dramatically to 29% from 11% in 2017. Included in other is 22pp of contribution from click and collect.
If you have purchased groceries online, was your typical online grocery order larger, smaller or the same size as a trip to the grocery store?
About 48% (20% bigger + 28% same) of respondents indicated their online orders were the same size or bigger than their purchases in-store. This is a 4-year high and up dramatically from 2017 (26%). 2017 was the year when trial was increasingly converted to recurring, and basket sizes for online will continue to grow.
Which attribute of online grocery shopping do you find most appealing?
Convenience continues to be the leading reason respondents use online for grocery, with 54% identifying it as the primary reason (56% in 2017 and 53% in 2016). Encouragingly, more respondents indicated price was the most appealing attribute (16% in 2018 from 13% in 2017). Some online options, including click and collect, offer in-store or closer-to-in store pricing than some of the first e-commerce models, with some membership and per-order price reductions. Service and quality also improved at 12% and 9%, respectively (from 6% and 3% in 2017, respectively).
Over the past year, has your online grocery spend increased, decreased or stayed the same?
Given the increased online shopping frequency, the increased online basket size indicates that respondents were spending more money online. For instance, 87% of respondents said they were spending the same or more on online grocery compared to a year ago. This is a new question for the survey that we will continue going forward.
Do you anticipate that you will begin buying groceries online in the next six months?
Of respondents who currently don’t use online for grocery, 19% indicated they would begin doing so in the next size months. This is a 4-year survey high and suggests online grocery shopping growth will accelerate in 2019. In 2017, the survey showed 10% of respondents indicating they would begin using online for grocery. Subsequently, the 2018 survey showed an 11pp usage increase. With even more folks anticipated to begin using the service, adoption appears likely to accelerate in 2019.
What is the largest contributing factor in your reluctance to purchase groceries online?
Consistent with prior years, for those who aren’t currently buying groceries online, the inability to touch and feel the items continues to be the dominant reason. However, respondents who selected “Other” decreased to 10% in 2018 from 15-16% in the prior years. Majority of respondents who chose “Other” said they enjoy grocery shopping in person and/or don’t see the need of buying groceries online.
If you’ve purchased grocery items at Amazon, how often do you purchase?
Online grocery shopping on Amazon saw a material bump. Of those who use Amazon for grocery shopping, 17% of respondents indicated they do so at least once a week. This is up dramatically from 5% in 2017, and compares to 22% for overall online grocery shopping channels.
Over the past year, has your online grocery spend on Amazon increased, decreased or stayed the same?
Given the increased online shopping frequency, nearly 83% of respondents who shopped for groceries on Amazon indicated they were spending at least the same amount or more than last year on Amazon for groceries. This is about in line with the overall online grocery shopper results, where 87% of overall respondents indicated they were spending the same or more on online grocery compared to a year ago.
This is a new question for the survey that we will continue going forward.
Are you an Amazon Prime member?
Close to 64% of respondents are now Prime members, up 10pp Y/Y. This compares to 55% based on a survey report conducted in May. Amazon seems to have gained new Prime members that were not members before, as 20% of responders last year were not Prime members vs 12% this year.
Now that Amazon owns Whole Foods, does that change your willingness to purchase grocery items on Amazon?
For instance, 29% of respondents said they are more willing to purchase grocery at Whole Foods post
Amazon acquisition vs. 22% last year. This could be driven by the increase in convenience (Prime Now and Whole Foods partnership) as well as frequent discounts for Prime members at Whole Foods stores.
Now that Amazon owns Whole Foods, would you expect to shop more often at physical Whole Foods stores?
Similarly, 19% of respondents indicated they are willing to buy more from Whole Foods post Amazon acquisition, up from 13% last year.
Have you observed any changes to prices at Whole Foods?
The majority of shoppers (73% of respondents) have not noticed much of price changes, and 17% believe prices are more expensive at Whole Foods. Only 10% believe prices are lower.
Have you used Amazon Prime Now/Whole Foods services?
Approximately 20% of Prime members are currently using Prime Now’s online service to order groceries from Whole Foods.
Do you think you have enjoyed discounts at Whole Foods as an Amazon Prime member?
Approximately 35% of Prime members said they enjoyed discounts (considerable or small) from Whole Foods.
Survey methodology. This annual survey was sent out to consumers aged 18+ and who identified themselves as the primary decision maker for groceries in the household. Overall, the survey collected 1,304 responses. RBC Capital Markets compared results to the prior year surveys (2015-2017), which were completed in the same manner and received a similar number of responses.
Looking for a reprint of this article?
From high-res PDFs to custom plaques, order your copy today!
")