Nielsen: "Frozen sales slow but strong"
Frozen food sales have slowed since the recession officially ended. Yet the aisle still churns $40 billion-plus in annual sales, largely by suiting the nation's need to conveniently juggle meal and snack times, says The Nielsen Company.
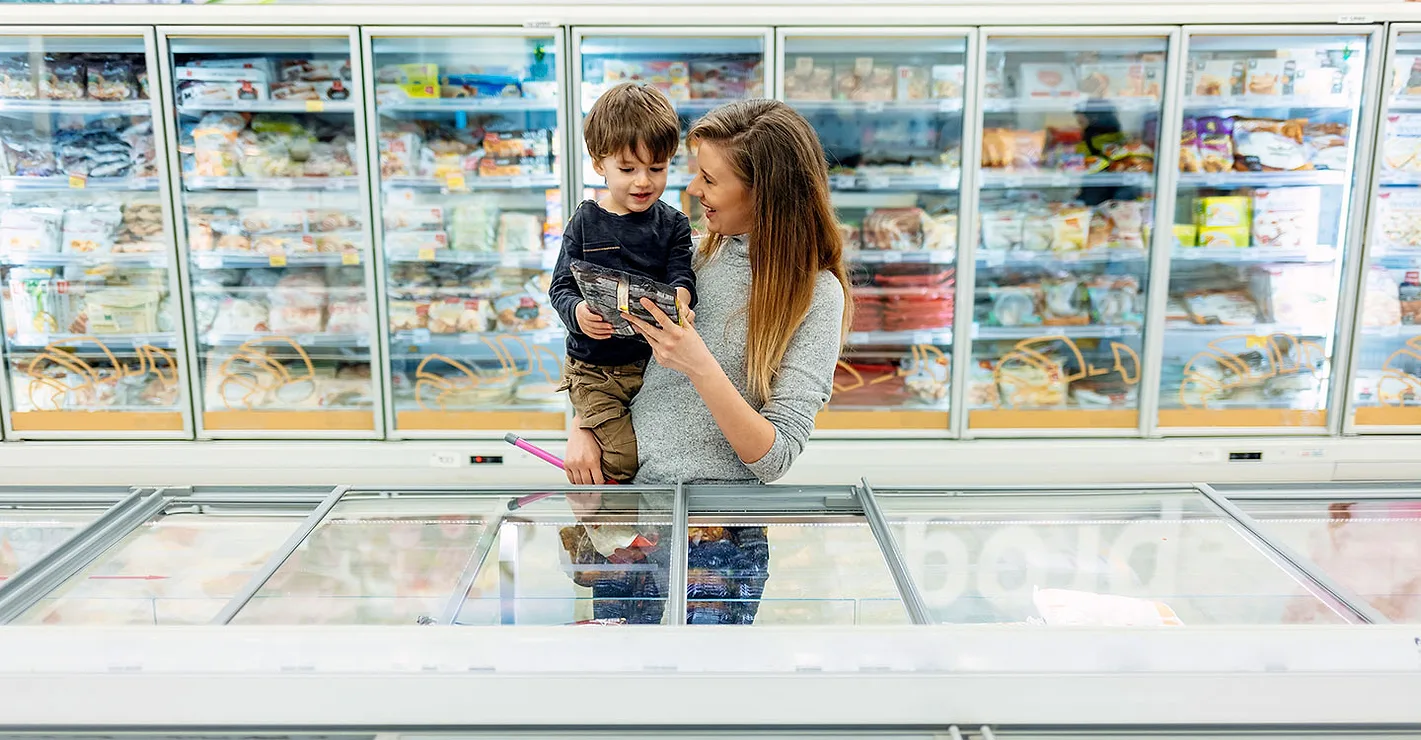
Hectic family schedules call for quick access to ready-made foods. Since kids and seniors can pop open a package and use a microwave when hungry, frozen foods solve a need for chief shoppers who can't be on steady call.
Health seems most relevant in segments such as vegetables, fruits and seafood, since they retain high amounts of nutrients when frozen soon after harvest or capture. Also, makers of prepared foods have progressed at reducing sodium, sugars and fats in some varieties. And when families want 'filling' and 'taste' over all, segments such as ice cream, novelties, snacks and desserts meet those needs.
Consumers appear to see value in this aisle, judging by frozen's growth in the peak of the recession. Dollar sales of the department grew by 2.7 percent a year ago but slid 0.8 percent to $40.25 billion in the 52 weeks ended March 19, 2011, in U.S. food, drug and mass merchandiser stores (including Walmart), show Nielsen data that track prepackaged, UPC-coded products only.
Frozens achieved recessionary growth in the U.S. without benefit of a visual stunt, such as the inventive one that occurred outside of Royal Festival Hall on London's South Bank in 2008. The British Frozen Food Federation created a wall of ice sculpture that suspended colorful fish, fruits and vegetables in rows of ice panels, and drew onlookers as if they were at a museum exhibit, according to photos in the Daily Mail.
Which are today's $1 billion-plus segments in America's frozen food aisles? According to Nielsen, there are nine:
•Prepared foods. Dollar sales up 2.0% a year ago and 0.2% to $11.81 billion in the latest 52 weeks, on successive 1.1% and 0.8% equivalized unit volume gains.
•Pizza/snacks. Dollar sales up 7.2% a year ago but down 4.0% to $5.22 billion in the latest 52 weeks, on a 6.6% EUV rise a year ago and a 1.1% EUV slip most recently.
•Vegetables. Dollar sales up 3.3% a year ago but down 0.8% to $4.71 billion in the latest 52 weeks, on a 0.1% EUV rise and a 2.5% EUV dip in consecutive years.
•Ice cream. Dollar sales down 1.5% and 2.4% to $4.57 billion in the two most recent years, on successive annual 1.1% and 3.5% EUV drops.
•Unprepared meat/seafood. Dollar sales up 4.8% a year ago but down 1.2% to $4.42 billion in the latest 52 weeks, on a 5.4% EUV rise a year ago and a 4.1% EUV skid most recently.
•Frozen novelties. Dollar sales up in two straight years, by 4.1% and 3.6% to $3.04 billion, on a 0.1% EUV dip a year ago and a 0.1% EUV gain most recently.
•Breakfast foods. Dollar sales up 1.8% and 4.7% in two consecutive years to $2.15 billion, on a 1.9% EUV drop a year ago and a 2.4% EUV rebound most recently.
•Baked goods. Dollar sales up 2.1% a year ago, but down 3.3% to $1.87 billion in the latest 52 weeks, on successive 0.6% and 2.0% EUV declines.
•Dessert/fruit/toppings. Dollar sales up 2.4% a year ago, but down 4.0% to $1.39 billion in the latest 52 weeks, on a 7.7% EUV rise followed by a 7.5% EUV decline most recently.
Looking for a reprint of this article?
From high-res PDFs to custom plaques, order your copy today!
")